Table 1.
Pore diameters and pore throat diameters
| Classification | Pore Diameters (μm)a | Pore Interconnect Diameters (μm)a |
 b b
|
|
| |||
| Small Pores | 62 ± 6 | 18 ± 2 | |
| Large Pores | 147 ± 15 | 62 ± 8 | |
based on SEM images (n=12);
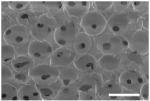
representative SEM image of porous structure formed from a PMMA sphere template, where the pore interconnects can be seen by the smaller black dots (scale bar = 500 μm)
