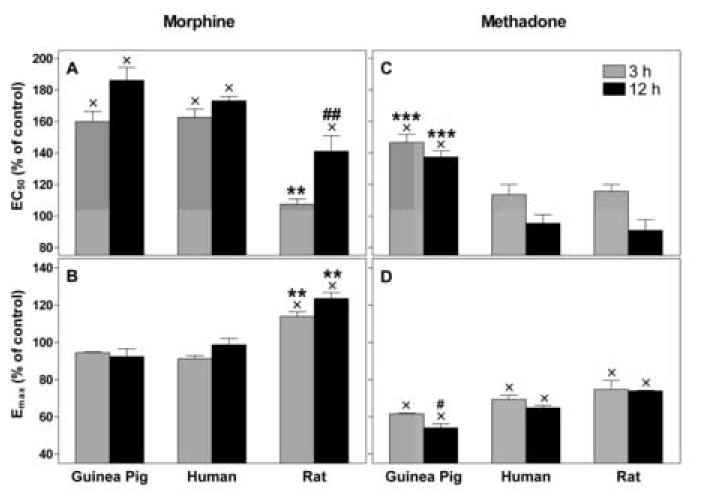
Figure 4.

DAMGO-stimulated GTPγS binding in opioid treated CHO cells. Cells were treated in culture as in Figure 3 with either morphine or methadone for 3 or 12 h. Dose response curves for DAMGO-stimulated GTPγS binding with homogenized membranes were generated. EC50 (panel A,C) and Emax (panel B,D) were calculated and are graphed as percent of paired control. Data is mean ± S.E.M of three independent experiments performed in duplicates for each concentration. Methadone-induced tolerance was different for the guinea pig mu opioid receptor compared to the other two species, as was the case for the rat receptor following morphine treatment. Significant time-dependent changes for both treatments are indicated.
x P < 0.05 vs. untreated control
** P < 0.01 vs. guinea pig and human
## P < 0.01 vs. guinea pig
# P = 0.05 vs. rat
*** P < 0.001 vs. human and rat
