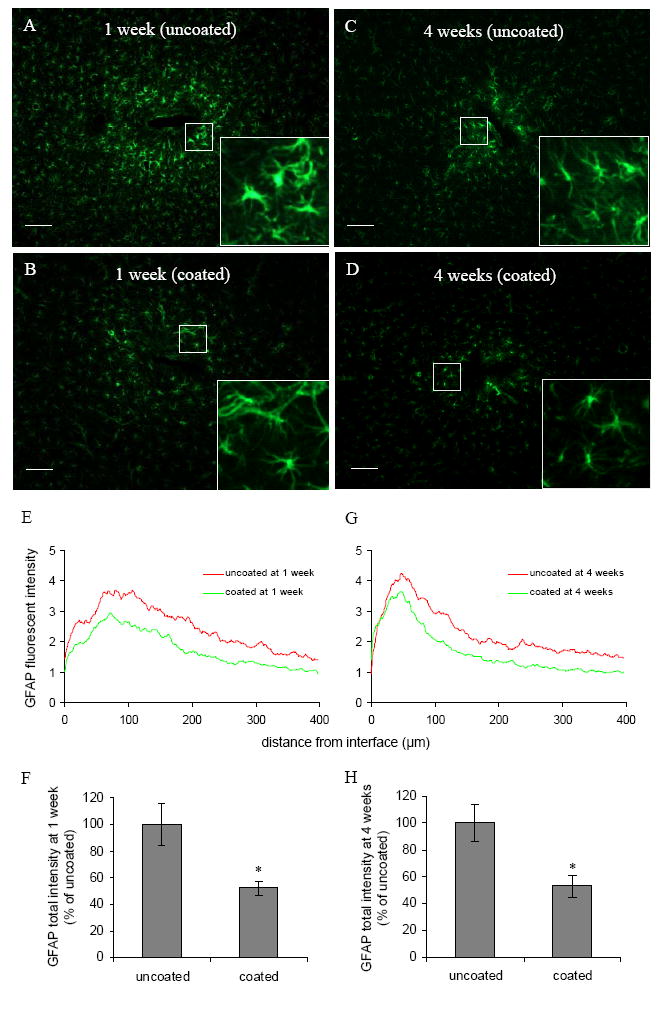
Fig. 2.

(A)–(D) Representative images of GFAP staining for astrocytes in the horizontal brain sections 1 week and 4 weeks post implantation for both uncoated and DEX coated probes. Scale bar = 100 μm. Inset denotes higher magnification (four-fold) of identified area showing the morphology of reactive astrocytes. (E, G) GFAP fluorescent intensity profiles as a function of distance 1 week and 4 weeks post implantation. (F, H) Quantification of total GFAP fluorescent intensity 1 week and 4 weeks post implantation (n = 4). *P < 0.05 compared with uncoated probes.
