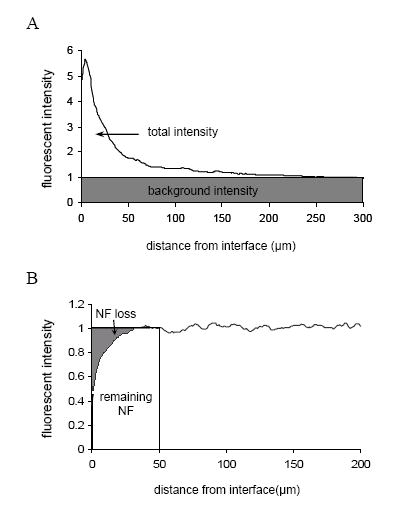
Fig. 7.

Diagram for quantification of (A) GFAP, ED1, and CS56 staining, the total area under the intensity-distance curve subtracted by the background (the shaded area) is defined as the total intensity, and (B) neurofilament staining, the percentage of the NF loss area relative to the sum of the NF loss area and the remaining NF area is defined as % of NF loss.
