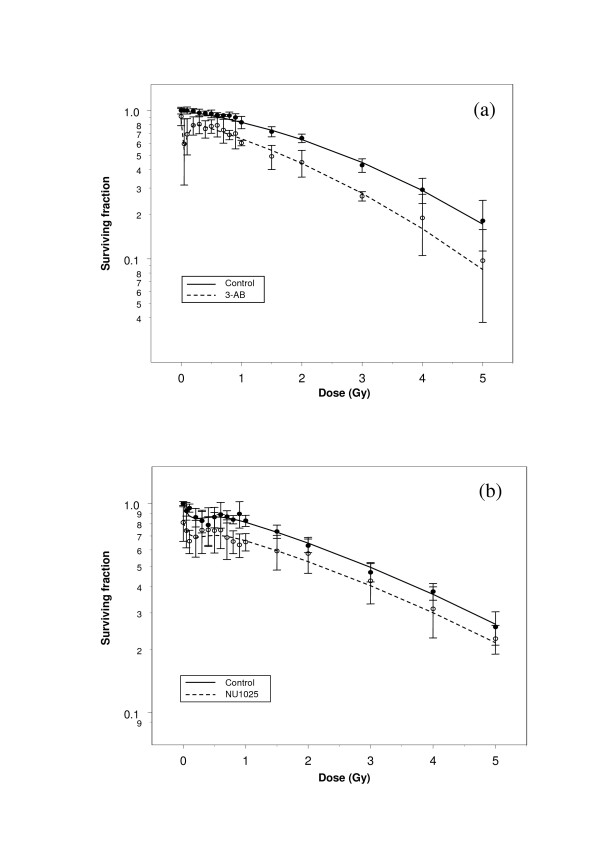
Figure 1.
Clonogenic survival curves derived from asynchronous, irradiated populations of (a) CHO-K1 hamster fibroblasts +/- 5 mM 3-aminobenzamide and (b) V79-379A hamster fibroblasts +/- 100 μM NU1025. In all figures, data points represent means (+/- standard error of the mean) of three independent experiments.

