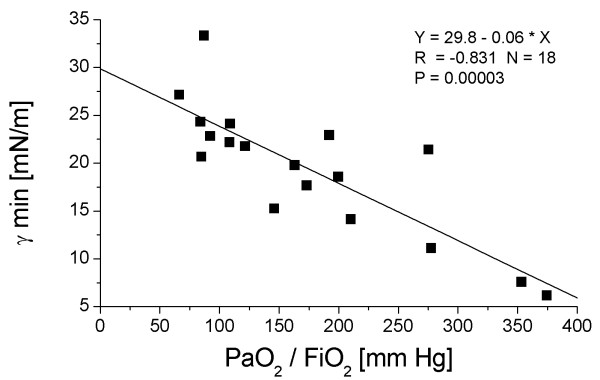
Figure 3.

Correlation between the minimum surface tension of the surfactant isolates (γ min) and the PaO2/FiO2 ratio (mean oxygen tension in arterial blood/inspiratory oxygen fraction) in ARDS patients at T0, T1 and T2. The Pearson correlation coefficient r is given. Due to the limited amount of large surfactant aggregates, complete data sets of surface tension values (T0, T1 and T2) were only measured in six patients.
