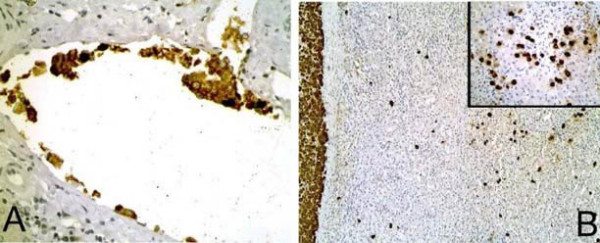
Figure 3.

(A) Multiple areas of intravascular invasion are found throughout the liver (H&E, 400×). (B) A stain for the neuroendocrine marker chromogranin reveals the tumor border at the left edge of the photomicrograph (H&E, 100×) with multiple scattered neoplastic cells spilling into the surrounding liver parenchyma (inset, H&E, 400×).
