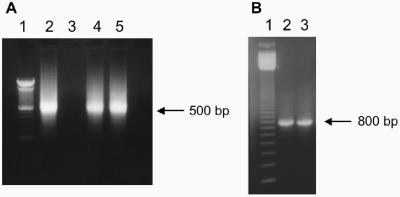
Figure 5.
Transcription of virF mRNA. (A) In vitro transcription of virF mRNA visualized with ethidium bromide on a 1% TAE agarose gel. The single-stranded mRNA ran at ∼500 bp in comparison to the 100-bp DNA ladder (lane 1). Lane 2: virF mRNA from a previous transcription reaction. Lanes 4 and 5: virF mRNA from replicate transcription reactions. (B) RT–PCR samples visualized with ethidium bromide on a 1% TAE agarose gel. RT–PCR was conducted using extracted mRNA from replicate samples (lanes 2 and 3), electrophoresed in comparison to a 100 bp DNA ladder (lane 1). Each RNA sample produced the corresponding 800 bp DNA species indicative of the virf ORF.

