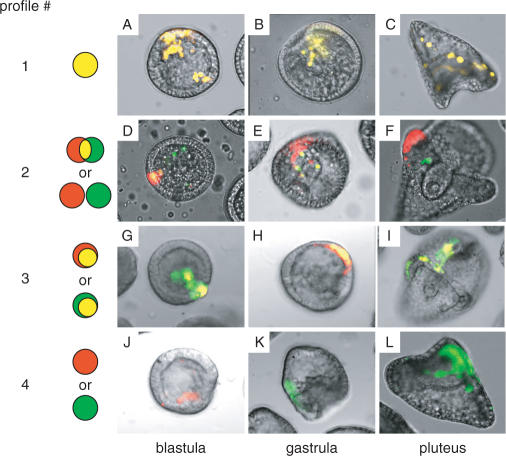
Figure 2.
Classification of the expression patterns of CFP/YFP reporter genes in transfected embryos. The expression of these two reporters were examined simultaneously in the same embryos using a fluorescence microscope (×200 magnification) at the blastula, gastrula and pluteus stages. Arbitrarily selected representative examples are shown as overlaid fluorescent and bright-field images. The CFP/YFP reporter plasmids transfected in these experiments are as follows: pM4694/pM4706 (A, C), pM4705/pM4692 (B), pM4947/pM4942 (D), pM4725/pM4692 (E), pM4705/pM4706 (F), pM7070/pM4706 (G, I), pM4694/pM7071 (H), pM4725/pM7073 (J), pM4694/pM7067 (K) and pM7070/pM7073 (L). Cells that express CFP or YFP are shown in green and red, respectively, whereas those that express both are shown in yellow. The expression patterns were classified into four groups as indicated: Profile #1, green and red signals completely overlapped; Profile #2, the signals partially overlapped or did not overlap; Profile #3, one signal was included within the boundary of the other and Profile #4, only one signal was observed.

