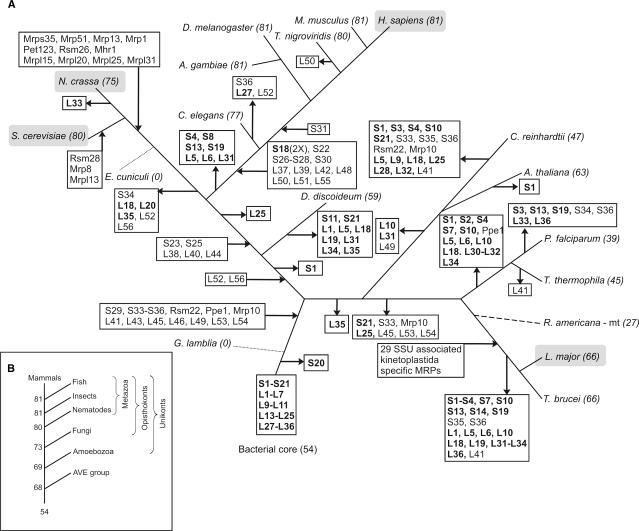
Figure 2.
Reconstruction of the evolutionary history of the mitochondrial proteome across the different eukaryotic lineages. (A) Incoming and outgoing arrows indicate the gains and losses of the MRPs that are indicated in the box. Genes encoding proteins of the bacterial core are shown in bold. The scenario of gene gain and loss was adjusted according to the MRP content encoded by the mitochondrial genomes of rice and R. americana (5) [dashed line, position in tree inferred from (89)]. Dotted lines indicate lineages with highly reduced mitochondria in which all MRP-encoding genes have been lost. Species for which the mitoribosomal proteome has been experimentally investigated are highlighted in a gray shaded box. Numbers following the species names denote the total number of MRPs identified in that species. Note that several MRPs have been lost independently in different lineages. For example, MRPS1 is lost independently in C. reinhardtii, A. thaliana (MRPS1 is encoded on the mitochondrial genomes of Oryza sativa and R. americana) and in the kinetoplastida and alveolata lineages. (B) Evolutionary trajectory towards the human mitochondrial ribosomal proteome. Main gene gain events can be observed at major branching points of the tree, such as in the ancestral eukaryote and at the origin of the metazoa, after which the mitoribosomal proteome is maintained at a constant level. AVE: alveolates, viridiplantae and excavates branch.

