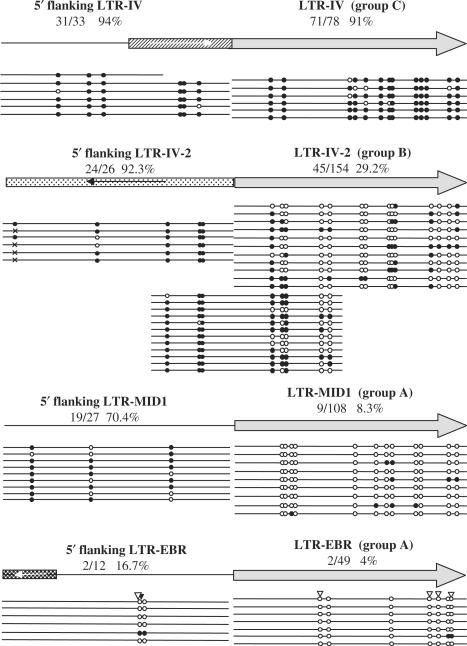
Figure 7.
Methylation levels of HERV-E LTRs and their flanking sequences. Grey arrows correspond to HERV-E LTRs, with their flanking sequence represented on the left by a line for unique genomic sequences or by a box for repeated sequences. The dashed box represents an Alu element, the white box with black dots an L1 and the black box with the white dots an L2 element. The orientation of the repeats is shown by arrows. The methylation of each region is shown below by lines corresponding to the sequence of a single clone. Other symbols are as in Figure 2.

