
Fig. 1.
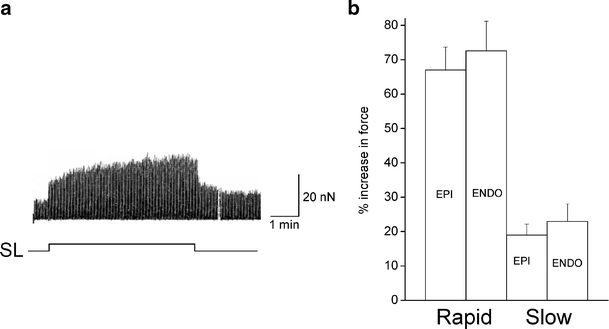
The inotropic response of left ventricular myocytes to axial stretch. a Representative trace showing the typical biphasic inotropic response of a myocyte to a stretch of 8% from a resting sacromere length (SL) of 1.85 μm. The trace shows changes in active force, resting force has been subtracted with a sample and hold device. The rapid increase in force is seen immediately upon an increase in SL, the slow response develops over the following minutes. b Mean data showing the rapid and slow response to stretch of ≅8% from a resting SL of ≅1.82 μm in sub-epicardial (EPI) and sub-endocardial (ENDO) left ventricular myocytes. The responses from EPI and ENDO cells were not significantly different from each other. P > 0.05, n = 18 EPI , n = 11 ENDO