
Fig. 1.
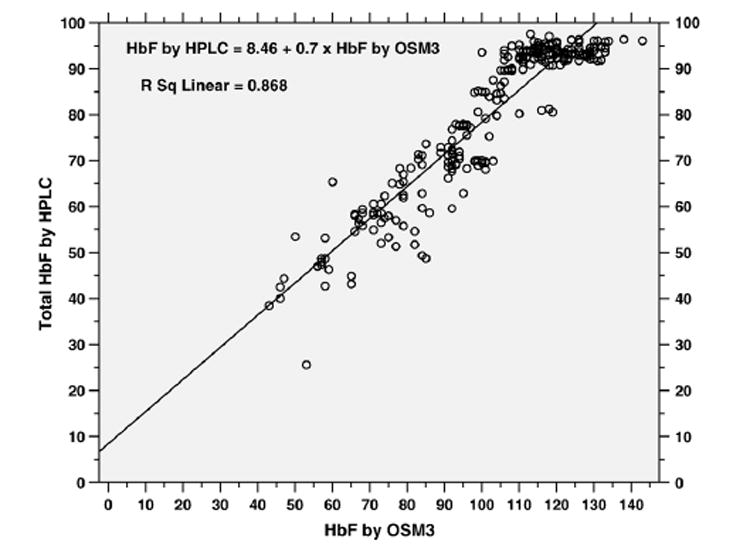
Scatter plots of HbF measured by OSM3 hemoximeter (X-axis) and HbF (%) measured by HPLC (Y-axis) with a regression line (n = 280 blood samples).
Official websites use .gov
A
.gov website belongs to an official
government organization in the United States.
Secure .gov websites use HTTPS
A lock (
) or https:// means you've safely
connected to the .gov website. Share sensitive
information only on official, secure websites.
Scatter plots of HbF measured by OSM3 hemoximeter (X-axis) and HbF (%) measured by HPLC (Y-axis) with a regression line (n = 280 blood samples).