
Figure 3.
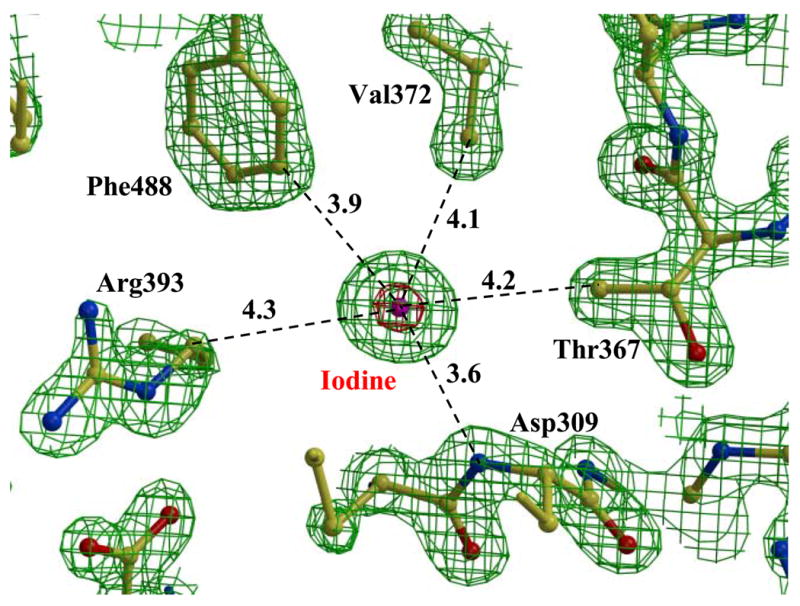
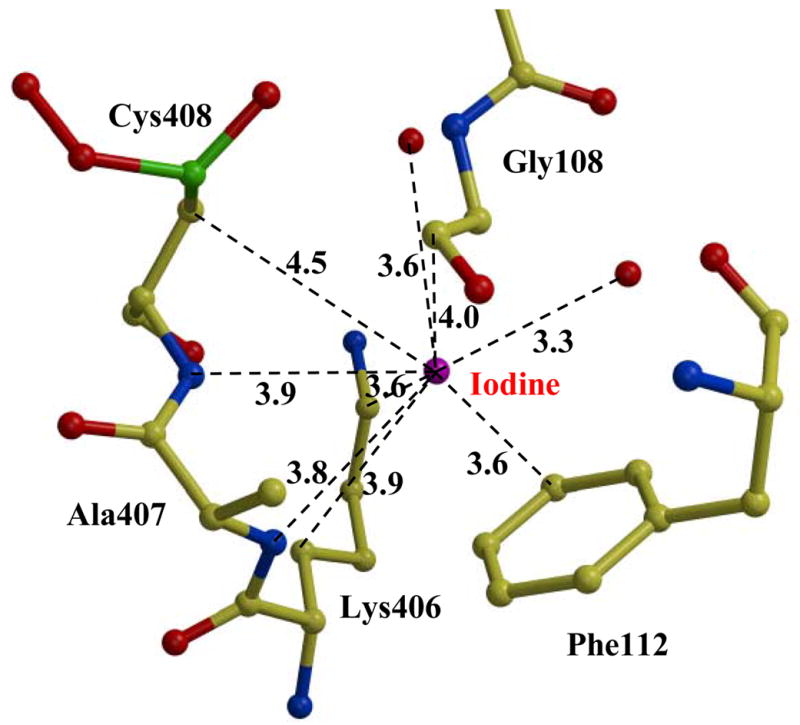
Iodine in the Est55 crystal structure. A) The conserved iodine site. 2Fo-Fc electron density map contoured at 2.0 σ (green) and 10.0 σ (red). Water is indicated by red spheres. Interatomic interactions are shown as dashed lines with distances in Å. B) The second iodine site in Est55-pH6.2.