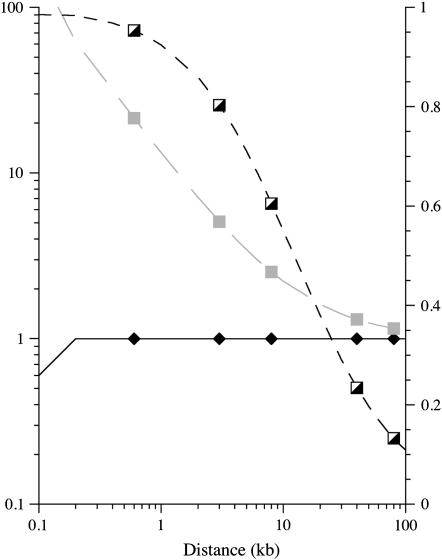
Figure 2.—
Example showing the predicted values of three observable quantities. The number of alleles at the selected locus (n) in this example was assumed to be 50, and the recombination rate in the region was 0.1 cM/Mb. An effective population size of Ne = 10,000 was assumed. The coalescence times are shown relative to those for loci unlinked to the S locus (predicting the relative nucleotide diversity values). The left y-axis shows both the scaled within- and between-allele values Twithin and Tbetween (solid line and solid diamonds and shaded dashed line and shaded squares, respectively), and the right y-axis shows the predicted values of FAT (equivalent to the estimated KAT between alleles in different S haplotypes, shown as solid/open squares and a solid dashed line).

