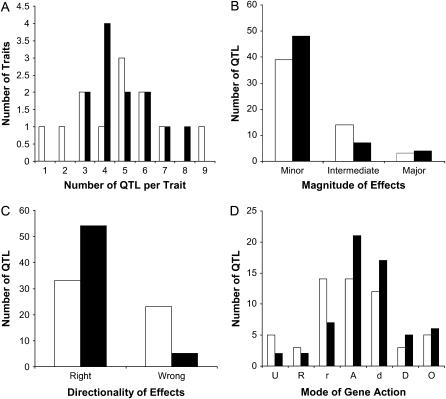
Figure 2.—
Comparison of the number of QTL (A) per trait, (B) magnitude of effects, (C) directionality of effects, and (D) mode of gene action between a previous study based on an elite × wild sunflower mapping population (open bars) (Burke et al. 2002) and the present study, which was based on a primitive × wild mapping population (closed bars). The following thresholds were used to classify the mode of gene action for each QTL: underdominant ≤ −1.25 < recessive ≤ −0.75 < partially recessive ≤ −0.25 < additive ≤ 0.25 < partially dominant ≤ 0.75 < dominant < 1.25 ≤ overdominant.

