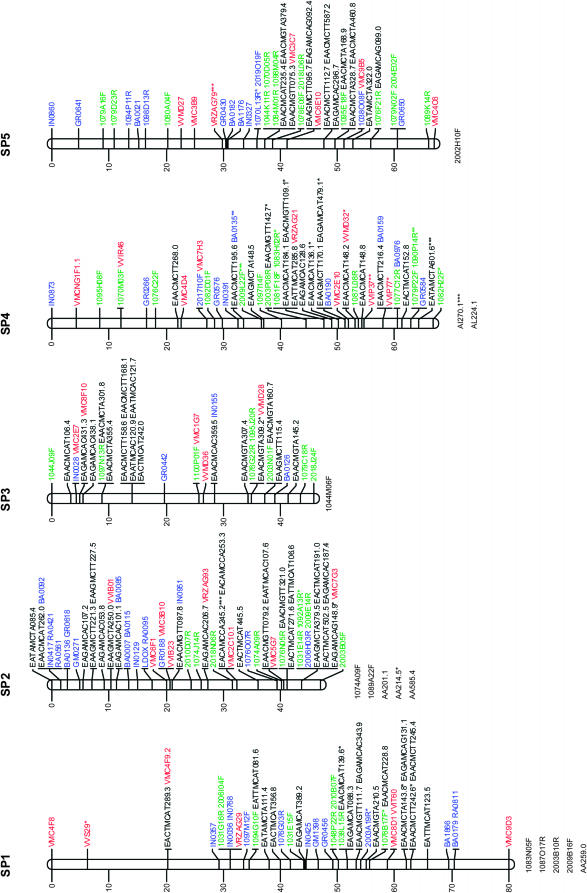
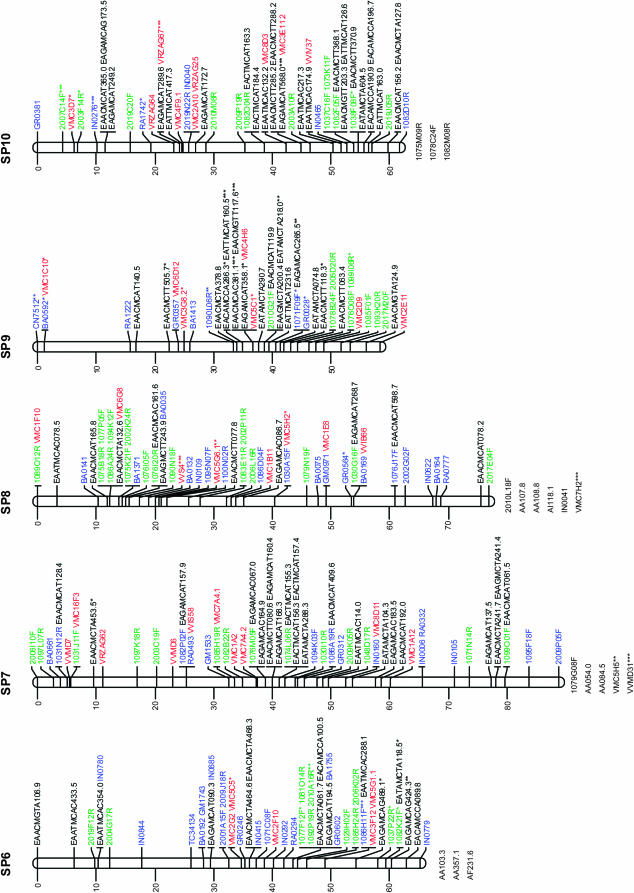
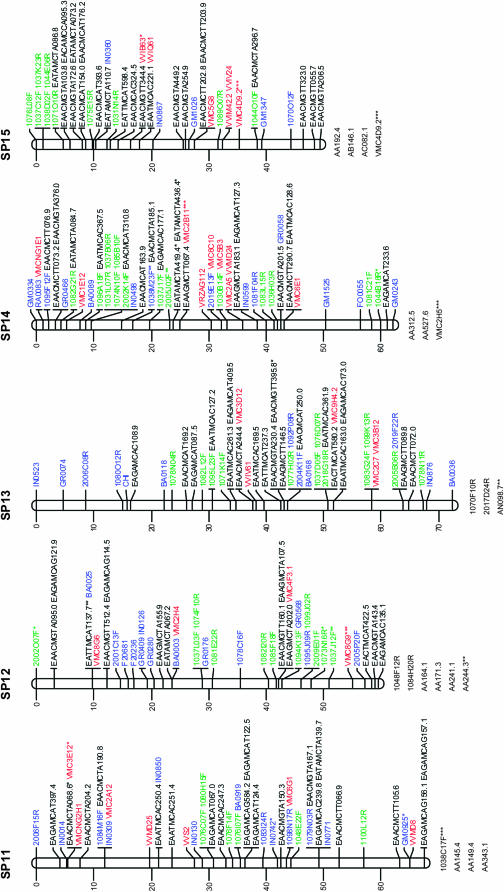
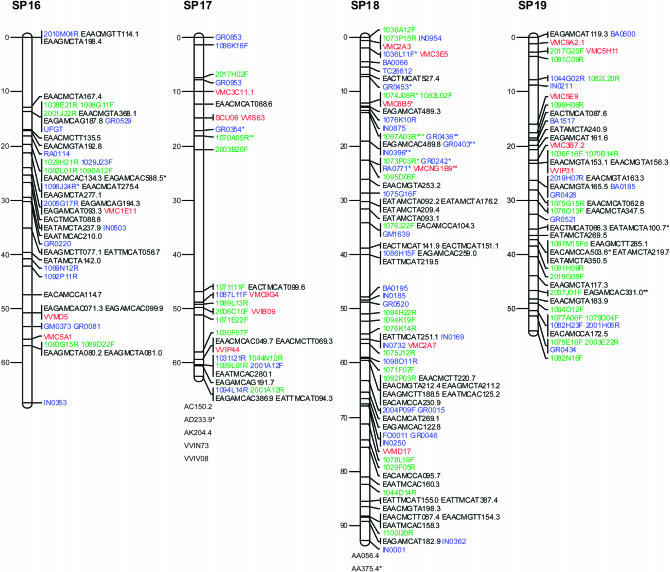
Figure 1.—
Consensus linkage map of Vitis vinifera from the Syrah × Pinot Noir cross. Linkage groups are numbered according to the V. vinifera map of Adam-Blondon et al. (2004). Markers from EST and from coding BES regions are shown in blue, noncoding BESs in green, SSRs in red, and AFLP markers in black. Loci with a distorted segregation ratio are marked by asterisks (*P < 0.05; **P < 0.01; ***P < 0.001). Distances of markers from the top are indicated on the left in centimorgans. Linked markers that excessively increased the linkage group end distances or that affected the order of neighbors in the group were not included in the map and are listed below each linkage group.


