
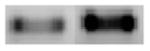
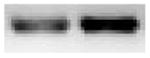
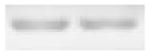
Table 3.
Quantitative RT-PCR analysis of select candidate genes
| Genes | Band size (bp) | DNA Gel Con - H2O2 | H2O2/con mRNA fold difference | Z-Ratio H2O2/Con |
|---|---|---|---|---|
| CCND1
cyclin D1 |
720 |
|
+ 4.1 | + 11.7 |
| STAT5B
Signal transducer and activator of transcription 5B |
326 |
|
+ 3.0 | + 4.0 |
| Jun B
proto-oncogene |
630 |
|
+ 2.8 | + 4.0 |
| PAWR
apoptosis, WT1, regulator |
852 |
|
+ 2.9 | + 3.7 |
| PSMD3
26S proteosome subunit, non- ATPase, 3 |
976 |
|
+ 2.8 | + 3.0 |
| MAP2K
mitogen-activated protein kinase kinase 1 |
1703 |
|
− 1.1 | − 3.2 |
| GAPDH
Glycerol Aldehyde Dehydrogenase |
640 |
|
+ 1.0 | - |
Total RNA was extracted from control and H2O2-treated N27 cells using the Trizol reagent. RT-PCR was performed using the primers designed against the rat species (see methods section for more details).