
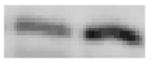
Table 4.
Western blot analysis of select candidate genes
| Genes | Band size (kDa) | Western blot Con - H2O2 | Protein H2O2/Con fold difference | Z-Ratio H2O2/Con |
|---|---|---|---|---|
| Jun B
proto-oncogene |
39 |
|
+ 3.0 | + 4.0 |
| STAT5B
Signal transducer and activator of transcription 5B |
80 |
|
+ 2.5 | + 4.0 |
| MEKK4
mitogen-activated protein kinase kinase kinase kinase 2 |
45 |
|
+ 3.6 | + 3.8 |
| PP2B
protein phosphatase 2B (calcineurin A gamma) |
60 |
|
+ 2.3 | + 3.0 |
| BNIP3
BCL2/adenovirus E1B interacting protein 3 |
19 |
|
− 3.0 | − 3.8 |
| β–actin | 43 |
|
+ 1.0 | - |
Control and H2O2-treated cell extracts were separated on 10–15% SDS-PAGE followed by western blot. Primary antibodies that would recognize the rat species were used in this study (see methods section for more details).