
Figure 4.
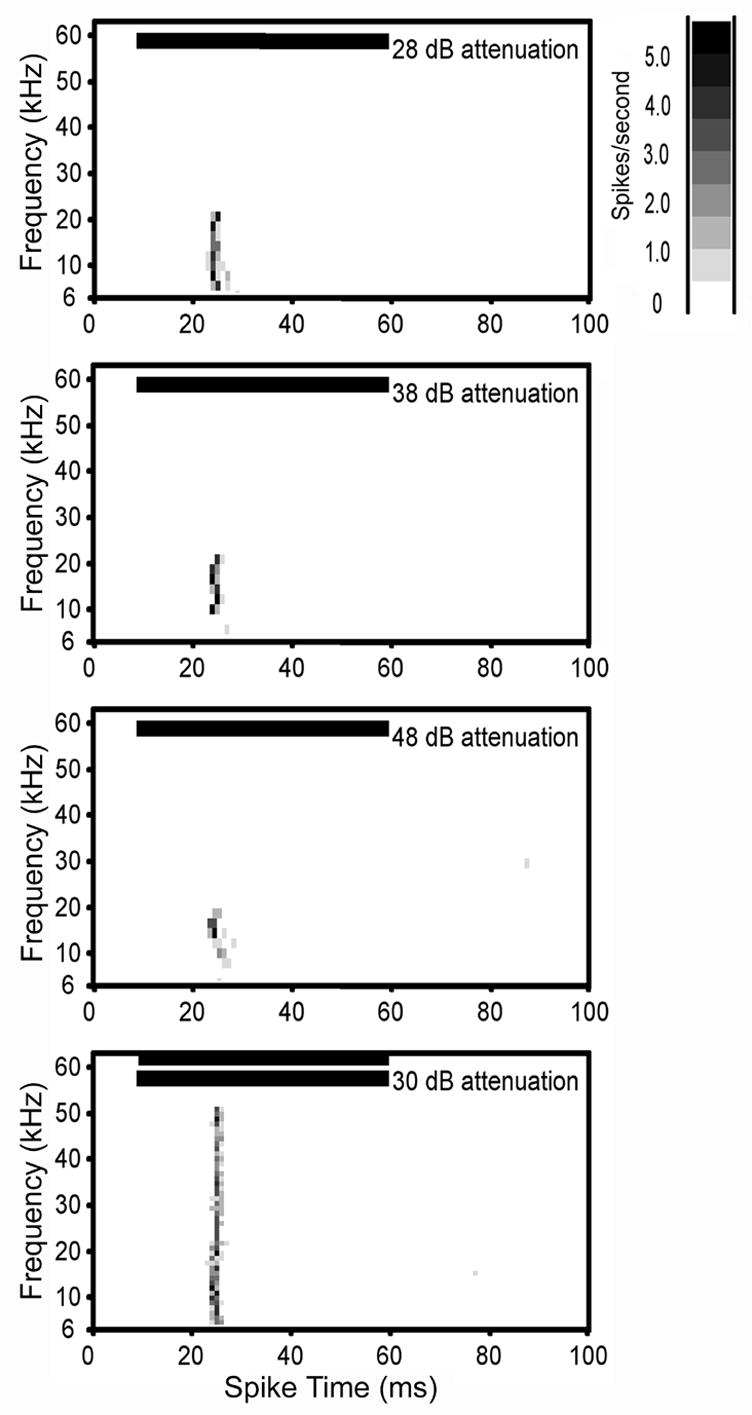
Spectral temporal plot of a class III neuron. Class III neurons were characterized by symmetrical V-shaped excitatory tuning that broadened with increasing intensity. The single unit in this figure had a CF of 18kHz and a threshold of 41 dB SPL. It had an onset response and its excitatory response area broadened on the high and low frequency side with increased intensity (top 3 plots). The two-tone test (bottom plot) showed that there was no side band inhibition. Horizontal bars in each plot show the onset and duration of the stimulus. Bin width for all plots is 1 ms. See figure 2 legend for additional details on spectral-temporal plots.