
Figure 6.
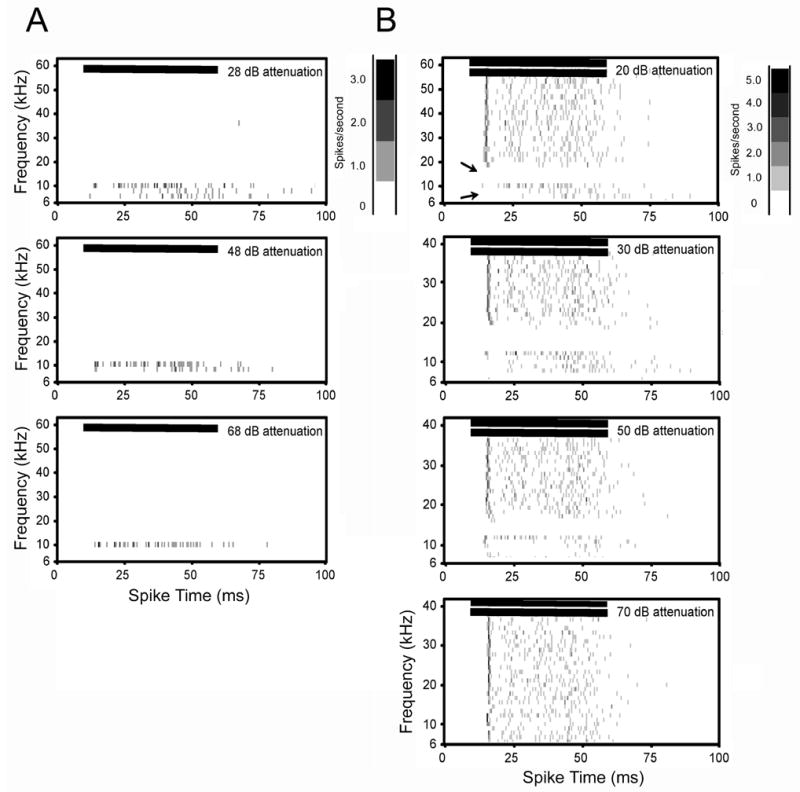
Spectral-temporal histogram of a neuron with strong inhibition. The CF and threshold of this unit were 12 kHz and 14 dB SPL, respectively. A: Frequency tuning from single tone tests. Frequency tuning remained sharp as the stimulus intensity increased. B: Inhibitory response areas obtained from two-tone tests. A CF tone was held constant at 24 dB SPL while the frequency and intensity of a second tone was varied. Strong inhibition flanked the excitatory CF region (arrows, top row). Suppression by the second tone persisted with decreasing intensity of the second tone until a threshold of 70 dB attenuation was reached (bottom three rows). Horizontal bars in each plot show the onset and duration of the stimulus. Bin width for all plots is 1 ms. See figure 2 legend for additional details on spectral-temporal plots.