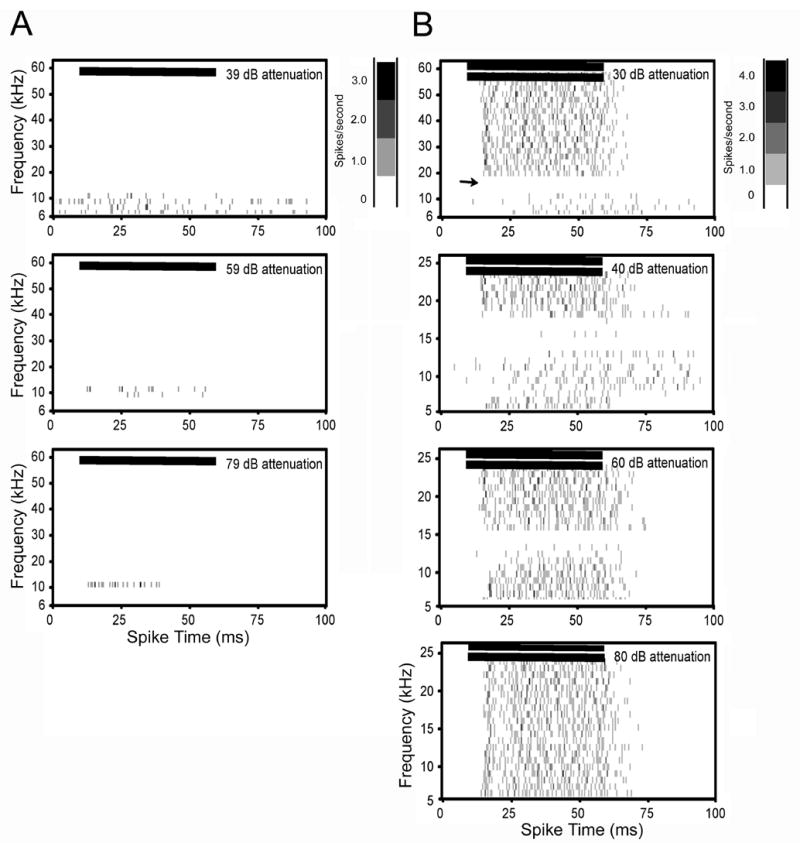
Figure 7.

Spectral-temporal histograms of single unit with strong inhibition. This unit displayed sharp frequency tuning and had a CF and threshold of 13 kHz and 14 dB SPL, respectively. Left column shows frequency tuning from single tone tests. The high frequency side of this unit’s excitatory response map remained sharply tuned at the highest intensity tested (top row). Right column shows two-tone tests. The high side inhibition had a sharp cutoff around 20 kHz (top row). Near threshold (70 dB attenuation), high side inhibition only extended to 16 kHz, but remained sharp (third row). Horizontal bars in each plot show the onset and duration of the stimulus. Bin width for all plots is 1 ms. See figure 2 legend for additional details on spectral-temporal plots.
