
Figure 9.
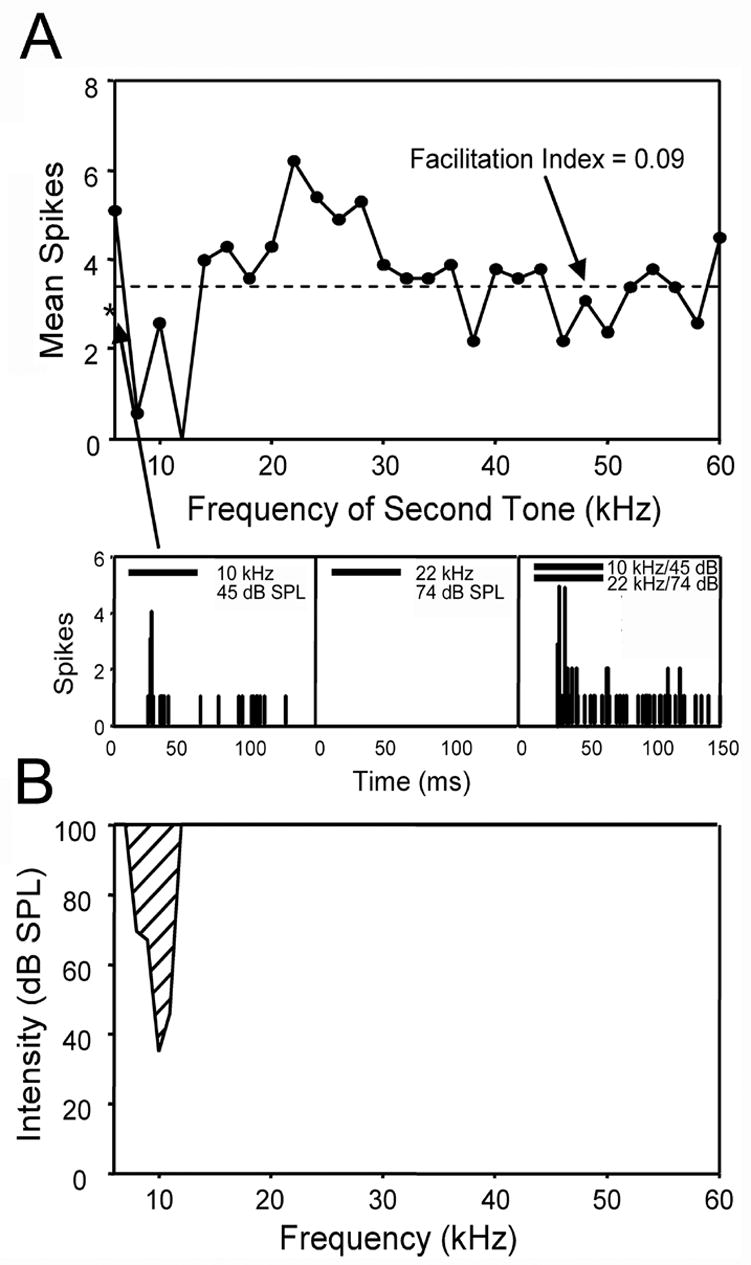
Facilitatory frequency response area of a single unit. Facilitation was determined using a two-tone paradigm, where one tone was presented at the unit’s CF and a second tone ranging from 6–60 kHz was presented simultaneously. A: Facilitation of a 10 kHz tone by a second tone at 22 kHz. The dashed line represents a facilitation index value of 0.09, corresponding to a 20% increase in the response magnitude to two tones compared to presentation of the CF tone alone. Any response above this line is defined as facilitation. The response to the CF alone is represented by an asterisk on the y-axis. Bottom left: PSTH of the response to the CF tone alone presented at 10 dB above threshold (45 dB SPL, horizontal bar). The mean spike count for the CF tone was 2.6 spikes/stimulus (asterisk). Bottom center: PSTH showing that the facilitatory tone of 22 kHz was not in the neuron’s excitatory frequency response area and did not elicit a response when presented alone at a high intensity level (74 dB SPL). Bottom right: Presentation of the CF and facilitatory tone elicited an increase in the response of more than two fold (6.2 spikes/stimulus) compared to the CF tone alone. The increase in response represents a facilitation index value of 0.41 which exceeds the criteria for facilitation (index value ≥ 0.09, arrow in A). Solid bar in PSTHs represents the sound stimulus. Bin width in PSTHs is 1 ms. B: Frequency tuning curve of the facilitated neuron in A, using single tone presentations. The facilitatory frequencies of the second tone (A) were beyond the neuron’s excitatory response area over a wide range of intensities (0–100 dB SPL).