. 2007 Jul 24;4:26. doi: 10.1186/1742-4682-4-26

Figure 4.

Figure 4

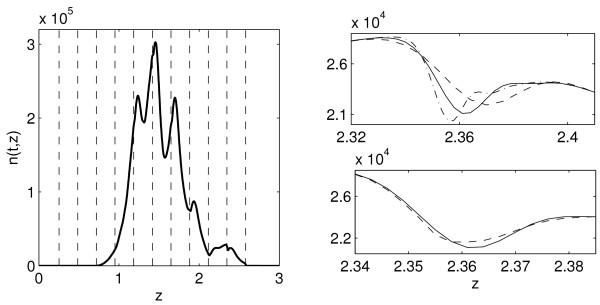
Propagation of the discontinuities of the solution to model (4) and the effect of the mesh refinement and the filtering procedure. Left: Solution n(t, z) of model (4) for t = 120 (hours) with the best-fit parameters estimated for data set 2. Dashed lines indicate positions of the discontinuities of the exact solution: zj MathType@MTEF@5@5@+=feaafiart1ev1aaatCvAUfKttLearuWrP9MDH5MBPbIqV92AaeXatLxBI9gBaebbnrfifHhDYfgasaacH8akY=wiFfYdH8Gipec8Eeeu0xXdbba9frFj0=OqFfea0dXdd9vqai=hGuQ8kuc9pgc9s8qqaq=dirpe0xb9q8qiLsFr0=vr0=vr0dc8meaabaqaciaacaGaaeqabaqabeGadaaakeaacqWG6bGEdaqhaaWcbaGaemOAaOgabaGaey4fIOcaaaaa@30A2@ = z0 MathType@MTEF@5@5@+=feaafiart1ev1aaatCvAUfKttLearuWrP9MDH5MBPbIqV92AaeXatLxBI9gBaebbnrfifHhDYfgasaacH8akY=wiFfYdH8Gipec8Eeeu0xXdbba9frFj0=OqFfea0dXdd9vqai=hGuQ8kuc9pgc9s8qqaq=dirpe0xb9q8qiLsFr0=vr0=vr0dc8meaabaqaciaacaGaaeqabaqabeGadaaakeaacqWG6bGEdaqhaaWcbaGaeGimaadabaGaey4fIOcaaaaa@3033@ - j log10 γ, j = 0, 1, ..., 10, z0 MathType@MTEF@5@5@+=feaafiart1ev1aaatCvAUfKttLearuWrP9MDH5MBPbIqV92AaeXatLxBI9gBaebbnrfifHhDYfgasaacH8akY=wiFfYdH8Gipec8Eeeu0xXdbba9frFj0=OqFfea0dXdd9vqai=hGuQ8kuc9pgc9s8qqaq=dirpe0xb9q8qiLsFr0=vr0=vr0dc8meaabaqaciaacaGaaeqabaqabeGadaaakeaacqWG6bGEdaqhaaWcbaGaeGimaadabaGaey4fIOcaaaaa@3033@ ≈ 2.58, γ ≈ 1.71. Right (top): The effect of the mesh refinement on the computed solution in a neighborhood of the discontinuity at z ≈ 2.347. Dashed, solid and dot-dashed curves indicate the solution computed using the mesh size N = 500, 1000, 2000, respectively. Right (bottom): The effect of the filtering procedure: the solution computed with and without the filtering (dashed, respectively solid curves). N = 1000.