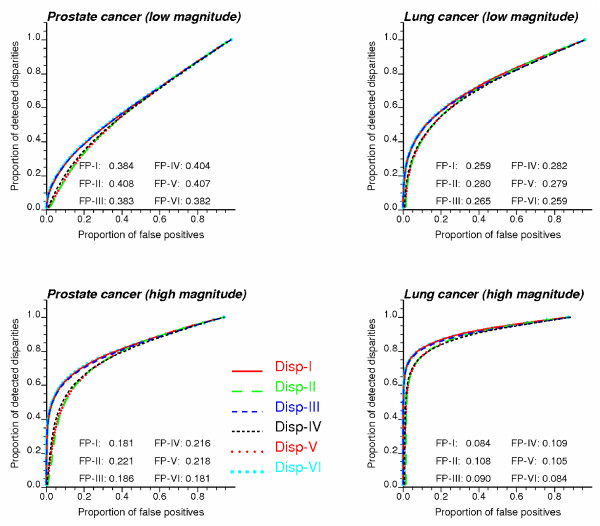
Figure 3.
Receiver Operating Characteristic (ROC) curves for the six disparity statistics. ROC curves plot the probability of false positive versus the probability of detection. These curves were obtained under two different scenarios for the magnitude of disparities (low = magnitude 1, high = magnitude 4) and a 10% frequency (i.e. 10% of counties have significant disparities). The average proportion of false positives (FP) is listed for each type of disparity statistics (two-tailed tests).

