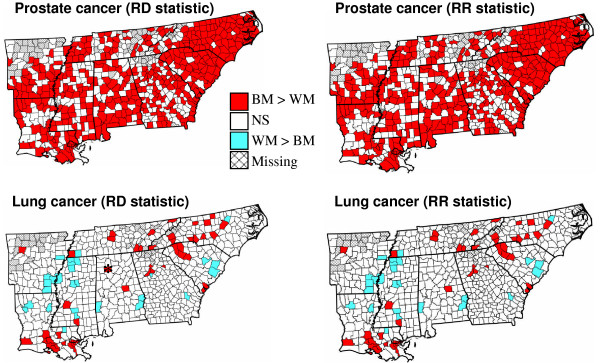
Figure 5.
Maps of counties with significant racial disparities for prostate and lung cancer mortality rates. Two-tailed tests based on the statistics DispI (RD type) and DispVI (RR type) were conducted at a significance level α = 0.01. White polygons depict non-significant (NS) differences, while hatched areas correspond to missing data. Thicker lines delineate state boundaries. Significant disparities are color coded according to the sign of the difference. The star in the lung cancer map indicates Winston County where the RD and RR statistics lead to different conclusions.

