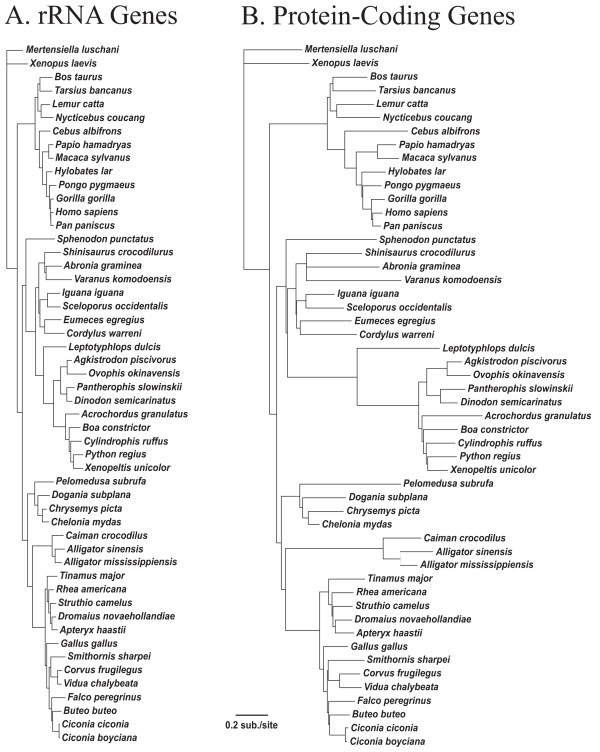
Figure 5.
Phylograms based on the relative branch lengths for rRNA and protein-coding genes. Branch lengths were estimated on the topology of the ML phylogeny (Figure 3). Branch lengths on this constrained topology were estimated using all rRNA genes (A) or all protein-coding genes (B). The substitution rate scale is the same in both trees.

