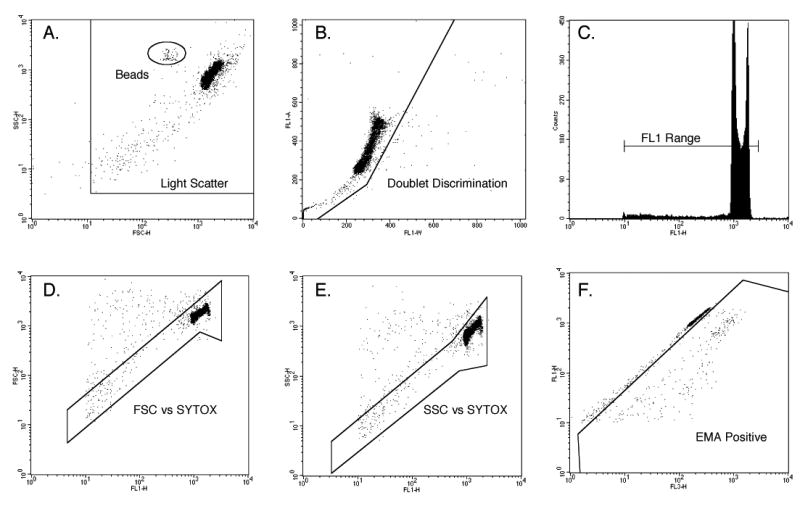
Figure 1.

Histogram and bivariate plots of TK6 nuclei and other subcellular particles as analyzed by flow cytometry. These panels illustrate the gating strategy used to discriminate nuclei and micronuclei from apoptotic chromatin as well as other spurious events. In order for events to be scored as nuclei or micronuclei, they needed to meet each of the following six criteria: within a side scatter vs. forward scatter region, panel A; within a region that excludes doublets, plot B; at least 1/100 the SYTOX-associated fluorescence as G1 nuclei, panel C; within a region that excludes doublets, plot C; within a forward scatter vs. SYTOX fluorescence region, plot D; within a side scatter vs. SYTOX fluorescence region, plot E; ethidium monoazide-negative, panel F. Note that once the dimensions and locations of these regions were set, they were not varied within or between experiments.
