
Figure 3.
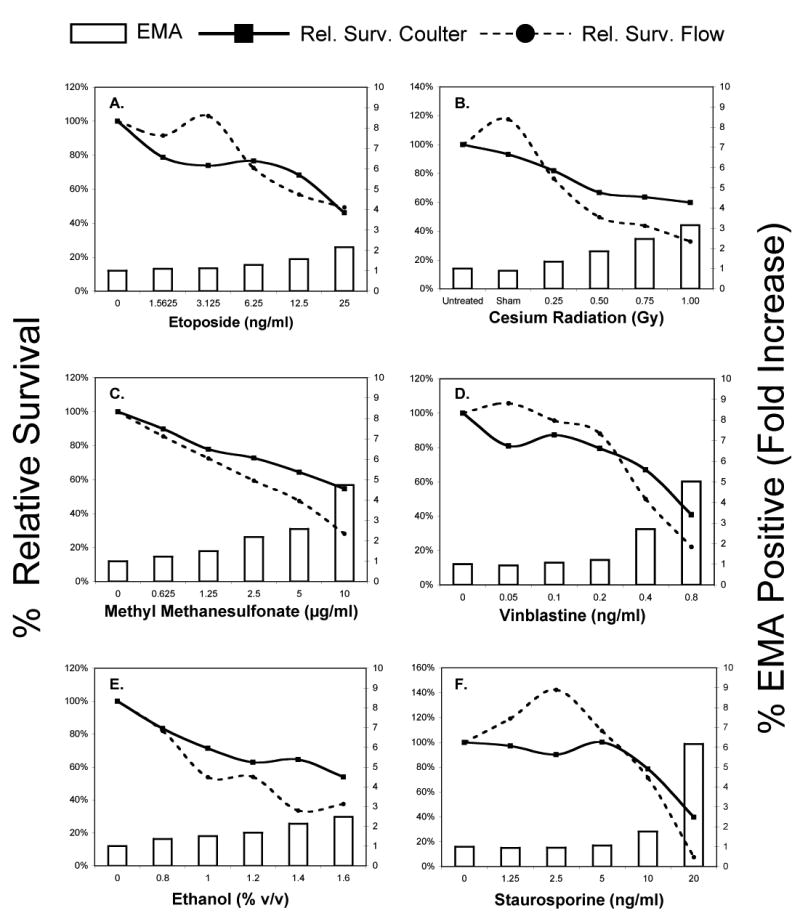
Cytotoxicity data are graphed for each of six test agents studied. The Y-axis shows mean relative survival as determined by Coulter counter (solid line) and also measured by flow cytometry in conjunction with counting beads (dashed line). Mean percentages of EMA-positive events (white bars) are graphed on the YY-axis (bars).