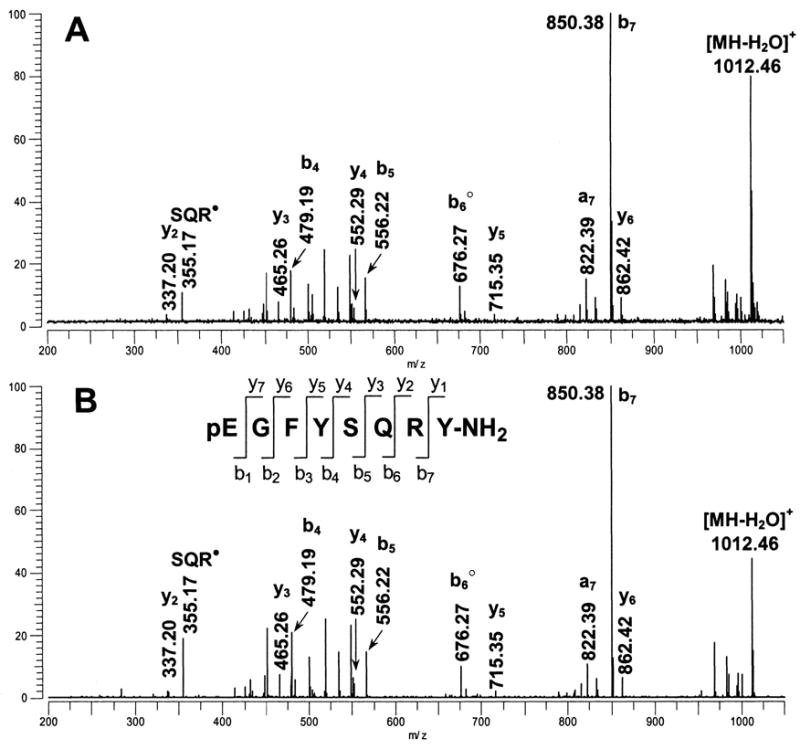
Figure 2.

SORI-CID MALDI-FTMS spectra of m/z 1030.47. (A) SORI-CID of the m/z 1030.47 peak detected in the direct tissue MALDI-FT mass spectrum of a pericardial organ from Pugettia producta. The m/z 1030.47 peak was dissociated following ion isolation using argon as the collision gas with an excitation amplitude of 6.5 Vbp, n=5; (B) SORI-CID of the m/z 1030.47, [M+H]+ peak, from a synthetic standard of pEGFYSQRYamide. The m/z 1030.47 peak was dissociated following ion isolation and argon was used as the collision gas with an excitation amplitude of 6.5 Vbp, n=1. The y-, b-, and a-type fragment ions are identified using the nomenclature established by Roepstorff (1984). Ions that have lost NH3 are shown with a filled circle, ions that have lost H2O are shown with an open circle.
