
Figure 1.
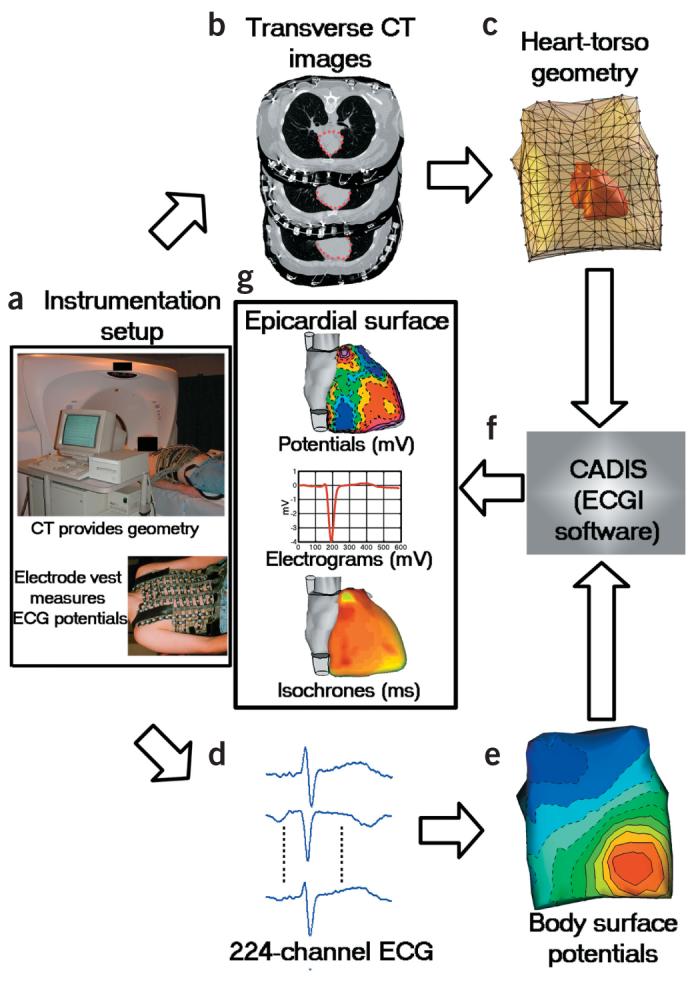
Block diagram of the ECGI procedure. (a) Photographs of instrumentation setup. (b) CT transverse slices showing heart contours (red) and body-surface electrodes (shiny dots). (c) Meshed heart-torso geometry. (d) Sample ECG signals obtained from mapping system. (e) Spatial representation of BSPM. (f) ECGI software package (CADIS). (g) Examples of noninvasive ECGI images, including epicardial potentials, electrograms and isochrones.