
Figure 5.
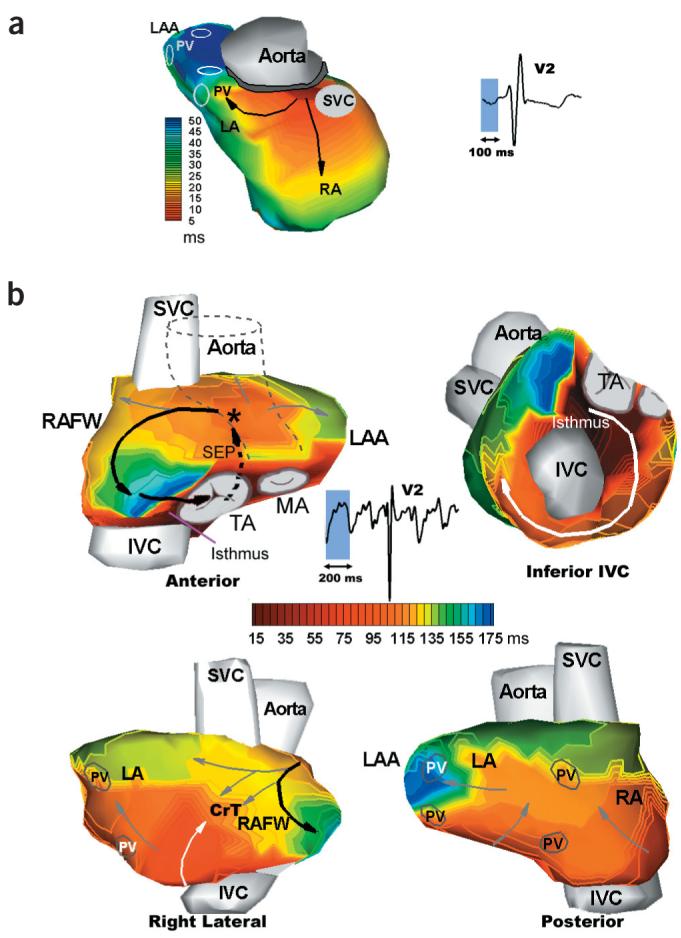
Atrial activation. (a) Normal isochrones for subject R. Left, superior-posterior view. Right, lead V2 of ECG, with P-wave shaded in light blue. (b) Isochrones during atrial flutter in subject AFL. Four views are shown. ECG lead V2 is shown, with imaged flutter cycle shaded blue. Black arrows in anterior view indicate the reentrant circuit beginning from isthmus, entering septum, emerging from Bachman bundle and propagating down right atrial free-wall (RAFW) to reenter isthmus again (a segment of the circuit is also indicated in right lateral view by black arrow). Solid arrows indicate epicardial activation; dashed arrow indicates septal activation. * indicates breakthrough at Bachman bundle. White arrows indicate wavefront propagation around IVC (inferior IVC view) and up RAFW (right lateral view). Activation of LA is shown by gray arrows in anterior and posterior views. LAA, left atrial appendage; SVC, superior vena cava; TA, tricuspid annulus; MA, mitral annulus; PV, pulmonary vein; SEP, septum; CrT, crista terminalis.