
Fig. 3.
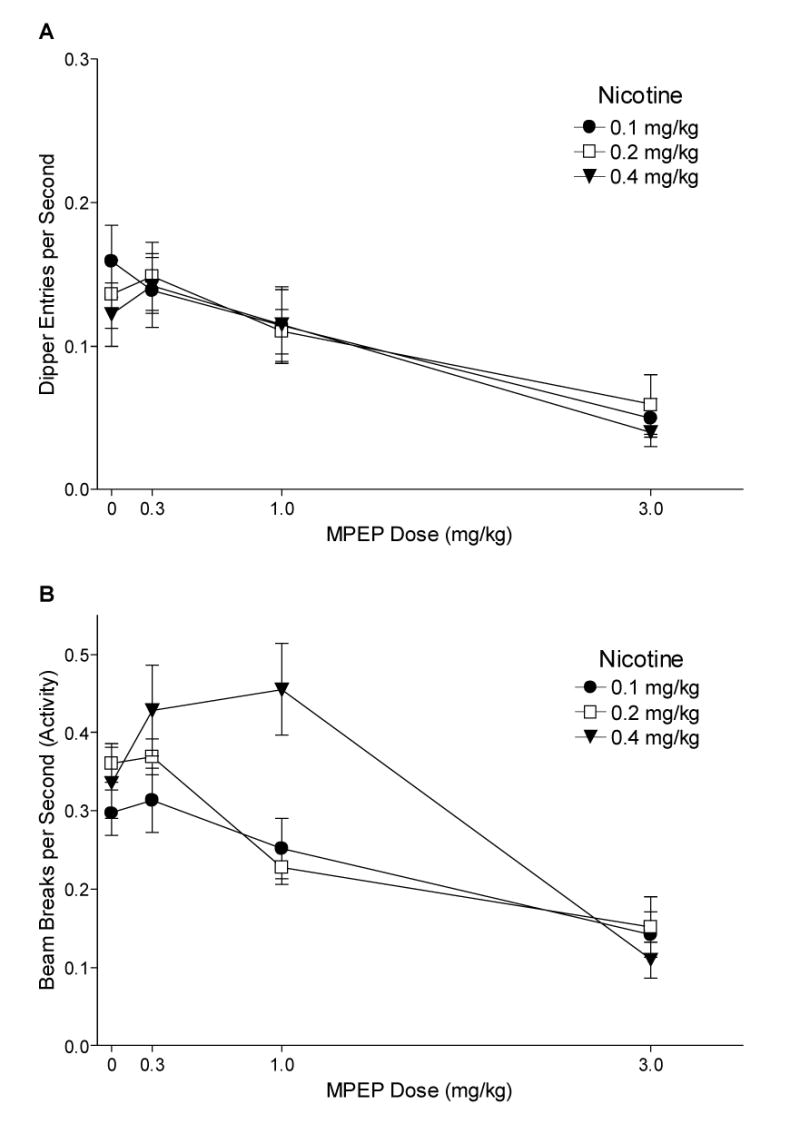
Panel A shows the mean dipper entry rates (±1 S.E.M.) of MPEP antagonism for each nicotine training group. Panel B shows the mean beam break (activity) rates (±1 S.E.M.) of MPEP antagonism for each nicotine training group. The number of rats per group for MPEP antagonism was 9, 9, and 8 for the 0.1, 0.2, and 0.4 mg/kg groups, respectively. For both panels, significant differences, ED50s, and baseline means are reported in the text.