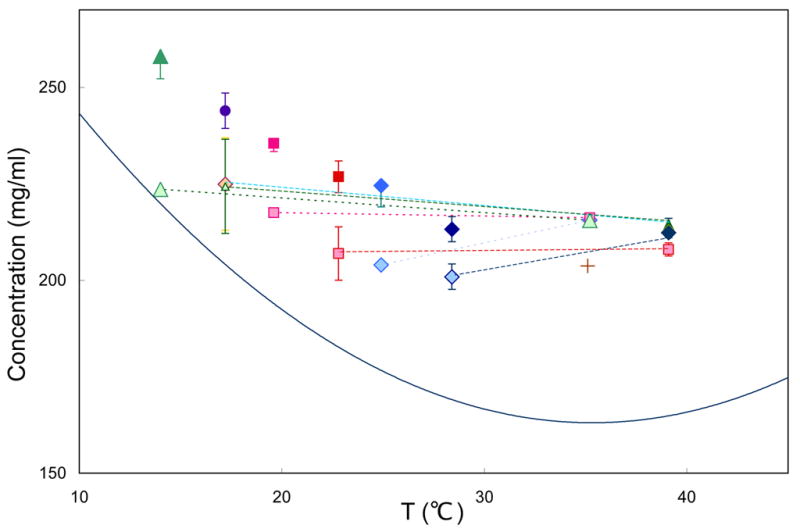
Figure 2.

Final concentration as a function of temperature. The solid curve is the solubility of HbS 12. All samples are in 200–300 μm droplets, in which the masked area is 4–5% of the total, and is placed at the center of the Hb drop. Points connected by dashed lines were polymerized at the higher temperature of the pair, and the temperature then was changed to the lower temperature. At the high temperatures, some symbols occlude others because the concentrations achieved were the same. All temperature-shift experiments involved polymerization at the high temperature, followed by shifting to a lower temperature, and then finally depolymerization. Solo points (all in darker colors) have been polymerized directly to the final temperature. The cross shows a concentration achieved by pressing on the slide, initially gelled at 35°C. Temperatures were regulated by a thermoelectric stage. Samples were observed by an Ealing 15×reflecting objective; spectra were recorded in the Soret region using an Ocean optics 2000 spectrometer. Photolysis was by a Lambda-Pro diode-pumped 532 nm solid state laser.
