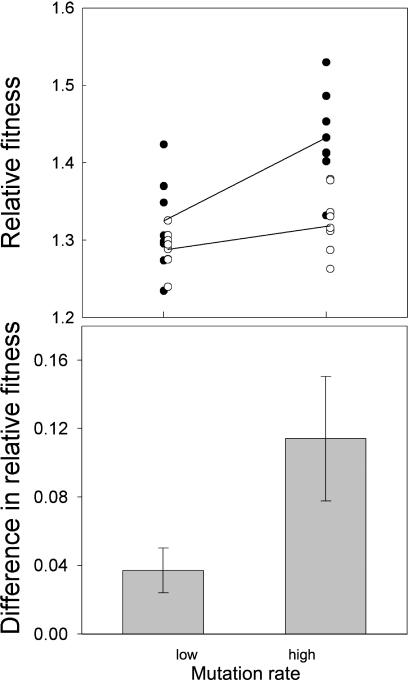
Figure 1. Interaction between Recombination and Mutation Rate on the Rate of Adaptation.
Top: each point represents the mean of ten replicate fitness estimates for one evolved line. Solid symbols indicate rec+ lines; hollow symbols indicate rec− lines. Lines connect the mean fitness of rec+ and rec− populations evolved in high and low mutation rate treatments.
Bottom: differences in relative fitness between rec+ and rec− lines at high and low mutation rate. Error bars are 95% confidence intervals. Recombination caused a significantly greater increase in adaptation in the high mutation rate treatment.

