Figure 2.


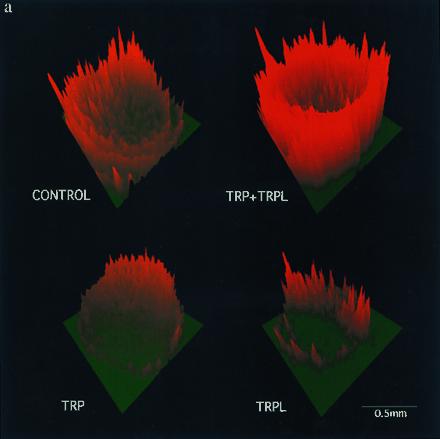
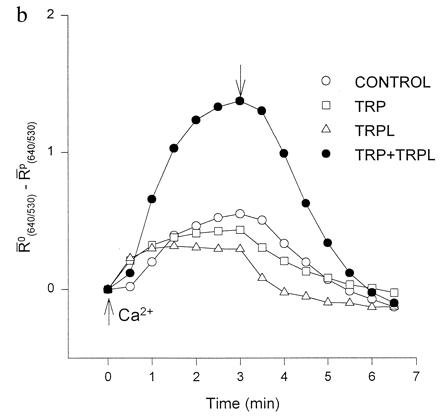
Coexpression of TRP and TRPL largely enhances Ca2+ influx into Ca2+ stores-depleted oocytes. (a) Confocal images of ratio changes between resting and peak Ca2+ levels during application of Ca2+ containing solution (2 mM). Changes of ratios were coded as the green-to-red gradient together with the z-axis magnitude. One pair of optical sections across the oocyte of about 70 μm deep was analyzed to form each image. The “ring” shape of the image is due to the melanin pigmentation, which interferes with the fluorescence detection from the center of the oocyte. (b) A plot of changes in fluorescence ratio as a function of time in the oocytes shown in a. The ordinate plots the average ratio difference (R̄o(640/530) − R̄P(640/530)) where R̄ is the averaged fluorescence ratio of the scan before (R̄o) or during and after (R̄P) Ca2+ application. The ratio of the pixels was averaged for a whole scan after threshold noise reduction. The normalized average ratio difference of TRP+TRPL was 2.08 ± 0.23 (n = 5) times the averaged control (n = 9), as compared with TRPL alone at 0.82 ± 0.10 (n = 5) times the control. The TRP+TRPL group was significantly different from the other oocyte groups (P < 0.01), whereas the other oocyte groups were not significantly different (P > 0.05). The initial Ca2+ level was variable among oocytes; therefore, ratio differences were used to demonstrate consistent results similar to those shown in Fig. 3 b and c. The magnitude of the ratio differences varied in different experiments; therefore, the summary results were normalized. The time of Ca2+ application and removal is indicated by up- and down-pointing arrows, respectively.
