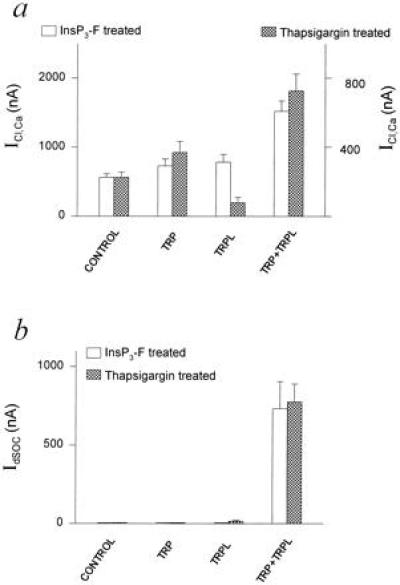
Figure 5.

Histograms summarizing ICl,Ca and IdSOC in TRP, TRPL, and TRP+TRPL-expressing oocytes in experiments similar to those in Fig. 3. (a) ICl,Ca measured in InsP3-F-treated oocytes (left ordinate) or thapsigargin-treated oocytes (right ordinate). Eleven independent experiments used 16–64 oocytes in each group. The TRP+TRPL groups were significantly different from the other oocyte groups (P < 0.01), whereas the other oocyte groups were not significantly different in the InsP3-F-treated oocytes (P > 0.05). In the thapsigargin-treated oocytes all groups were significantly different from each other (P < 0.01 for a comparison between the control TRPL and TRP+TRPL groups; P < 0.05 for a comparison between the control and TRP group). (b) IdSOC measured in InsP3-F or thapsigargin-treated oocytes. Seven independent experiments used 8–22 oocytes in each group.
