
Fig. 3.
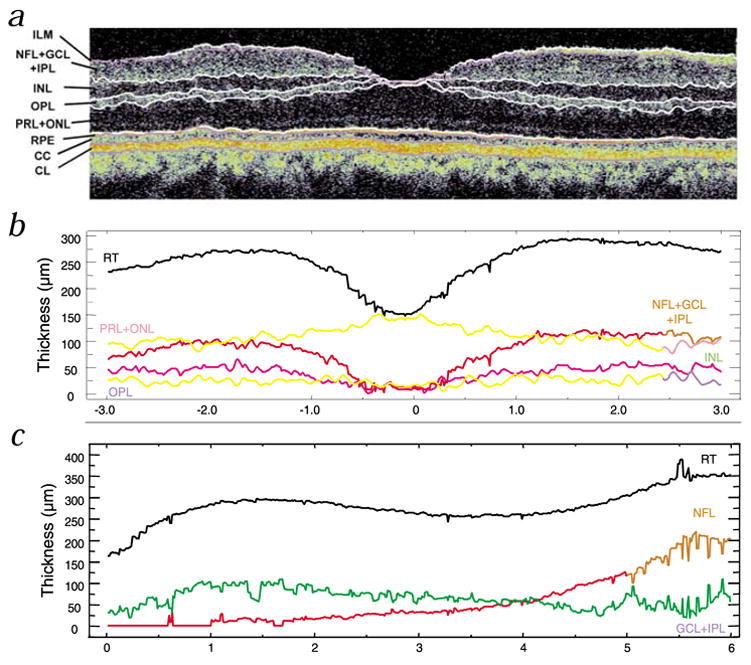
Quantification of intraretinal structures. a, Image-processed, segmented OCT image of the fovea. b, Corresponding plot of thickness of the retinal layers. c, Plot of thickness of retinal layers along the papillomacular axis. (The segmented OCT image of the papillomacular axis is not shown, but similar to that in Fig. 1.) The tomogram has been expanded by a factor of three in the vertical direction for better visualization of the retinal substructure. The measured thicknesses of the segmented layers (except the RPE and choroidal layers) are plotted as a function of transverse position (b and c). Clear visualization and quantification of the NFL is especially important for glaucoma diagnosis (c). NFL thickness increases towards the optic disc with a corresponding reduction in the thickness of the GCL and IPL layer towards the optic disc (see c). Choriocapillaris (CC); choroidal layer (CL); ganglion cell layer (GCL); inner plexiform layer (IPL); inner nuclear layer (INL); internal limiting membrane (ILM); nerve fiber layer (NFL); outer plexiform layer (OPL); photo receptor layer (PRL); retinal pigment epithelium (RPE); retinal thickness (RT).