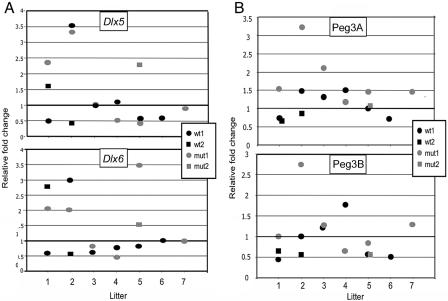
Figure 6. .
No increase in Dlx5 and Dlx6 expression in Mecp2-mutant mouse brain. A, Expression of Dlx5 and Dlx6 genes in frontal cortex of Mecp2 mutants (mut) compared with that of wild-type (wt) males from seven different litters, at age 7 wk (litters 1–5) or 9 wk (litters 6 and 7). For litters with more than one wild type or more than one mutant, individual animals are identified by different symbols (designated wt1 and wt2 or mut1 and mut2, respectively). Real-time qRT-PCR data from each mouse were converted to relative fold changes by comparison with a normalized sample, a wild-type mouse whose level of gene expression was closest to the mean value for all wild-type data—that is, wt1 in litter 3 for Dlx5 and wt1 in litter 6 for Dlx6. P values calculated by two-tailed, unequal variance are P=.4984 for Dlx5 and P=.5134 for Dlx6. P values calculated by one-tailed, unequal variance are P=.2492 for Dlx5 and P=.2567 for Dlx6. The plots illustrate the wide variability within and between litters. B, Expression of the imprinted gene Peg3, studied in the same forebrain samples used in fig. 6A, by qRT-PCR with two different primer sets (Peg3A and Peg3B). Expression levels were normalized to the same housekeeping gene, Rps28. The wide range of expression levels in individual mice and the similarity of patterns obtained with Peg3A and Peg3B primer sets indicate biological noise rather than technical variation.

