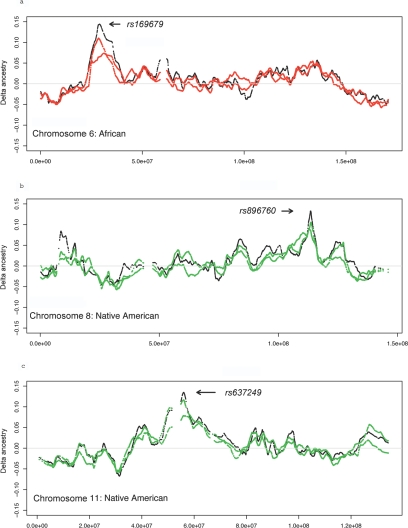
Figure 3. .
Extreme variations of ancestry on chromosomes 6 (a), 8 (b), and 11 (c). SNPs were divided into two sets (even-numbered vs. odd-numbered markers), which were analyzed separately with use of SABER. The red and green points are the excess African and Native American ancestries, respectively, on the two marker subsets, whereas the black points are the results with use of all available markers on that chromosome.

