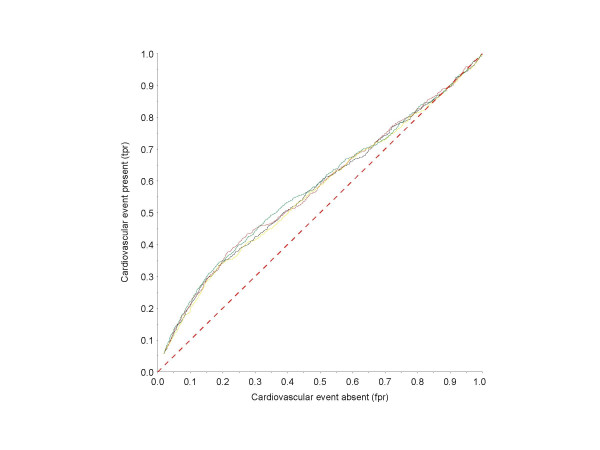
Figure 3.
ROC curves for the association between ABI values (according to different methods for ABI calculation) and the history of cardiovascular events (myocardial infarction or coronary revascularisation). Black line, method #1; red line, method #2; yellow line, method #3; green line, method #4. The red dashed line represents the line of identity of tpr and fpr.

