
Figure 2.
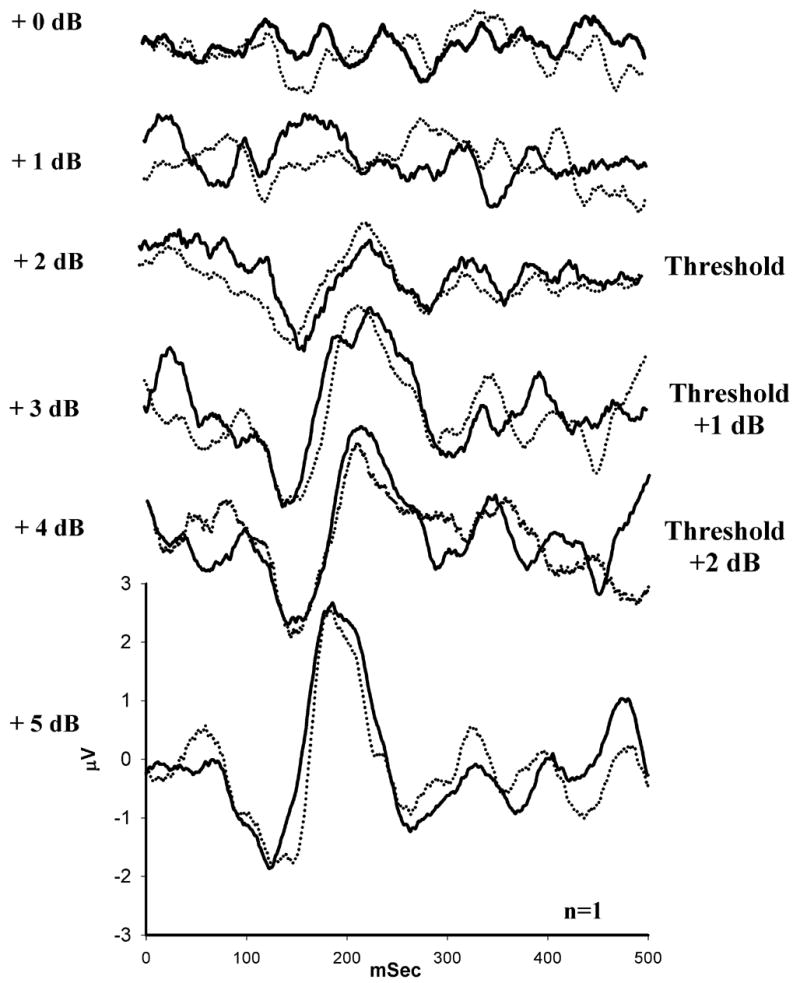
Representative waveforms recorded from a young subject (n=1) in response to a range of intensity increments (+0 dB to +5 dB) at 500 Hz. The subject’s intensity discrimination threshold was determined to be +2 dB (as labeled). Threshold was defined as the smallest intensity increment that elicited a repeatable N1-P2 response.