
Figure 5.
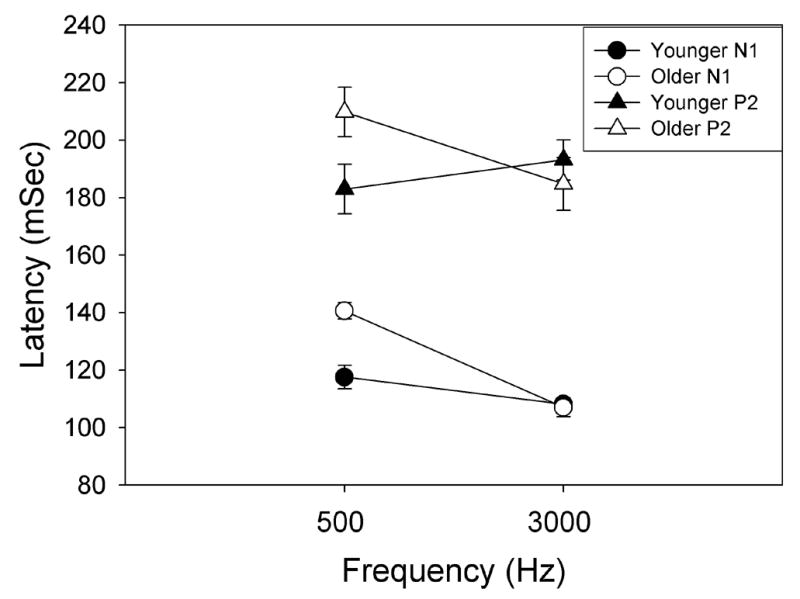
Mean N1 (circles) and P2 (triangles) latencies and standard errors are plotted for younger subjects (closed symbols) and older subjects (open symbols) in response to the largest intensity increments 500 Hz (+5 dB) and at 3000 Hz (+8 dB). N1 and P2 latencies were significantly prolonged in older subjects as compared to younger subjects at 500 Hz, but not at 3000 Hz.