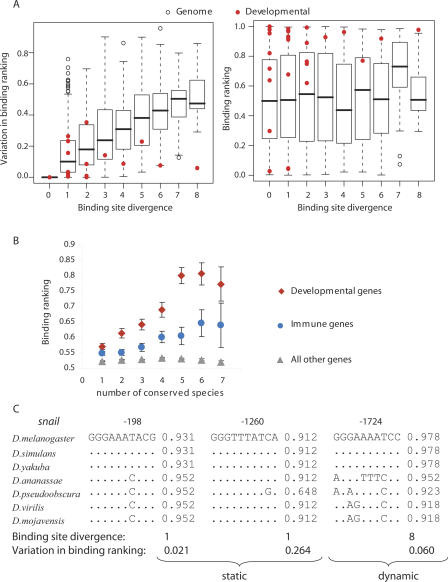
Figure 2.
High binding affinity to more conserved Rel binding sites in developmental and immune loci. (A) The relationship between a binding site sequence divergence and range in binding ranking (Δs) (left panel) or site binding ranking of the D. melanogaster site (SD_mel) (right panel). Red dots show the scores for known Dorsal-regulated developmental genes (Papatsenko and Levine 2005). Boxplots show distributions for all other genes. Boxplot parameters are defaults of the “R” package. (B) The relationship between the sequence conservation of Rel binding sites and their average binding affinity to Dorsal. For A and B each dot represents a site aligned in seven Drosophilla species. The sites were binned into three separate subsets according to their location: (1) within 2 kb of the start of a Dorsal-regulated developmental gene (red diamonds); (2) within 2 kb of the start of a gene involved in immune response (blue circles); and (3) within 2 kb of the start of all other genes not included in either of sets 1 or 2 (gray triangles) (see Methods). (C) Static (sequence) and dynamic (binding affinity) conservation of putative Rel binding sites in the upstream regions of the snail gene involved in developmental processes.

