Figure 7.
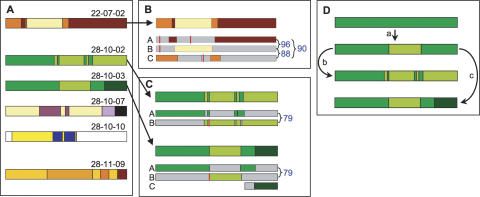
Structure and origin of putative mosaic cDNAs. (A) Mosaic structure. The seven detected mosaics for which significant donor information is available. Colors indicate patches matching different donors. The white regions in mosaic 28-10-10 indicate where no donor has been identified. (B) Origin and structure of N-terminal domain mosaic 22-07-02 from mouse 7 on day 22. The three putative silent donor genes (A, B, C) are shown below the cDNA, as thinner rectangles. Colors represent patches in common between donor and cDNA (positions of junctions in cDNA are averages where donors are identical in that region). The percentage nucleotide identity between silent donors is shown to the right. Vertical red bars depict frameshifts or stop codons in donor genes. The likely donors are: A, Tb11.v4.0074; B, Tb10.v4.0161; C, Tb11.14.0001. (C) Origin and structure of related mosaics coexisting in mouse 10 on day 28. Diagram is constructed as in B. For both mosaics, likely donors A and B are Tb11.09.0005 and Tb11.13.0003. For 28-10-03, likely donor C is read AZ217061. (D) Deduced pathway for development of related mosaics in mouse 10 on day 28.

