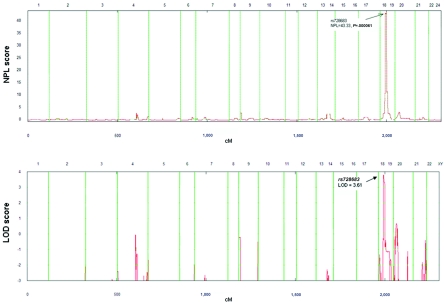
Figure 2. .
Multipoint linkage analysis with use of NPL in the genomewide scan of multigenerational family UR410 with NSCL/P. In the upper panel, the X-axis represents the chromosome location for the 22 autosomes, and the Y-axis represents the NPL score. The highest peak is on chromosome 18q21.1. In the lower panel, the X-axis shows chromosome location for the 22 chromosomes, and the Y-axis shows the location score, calculated using GENEHUNTER software. The maximal LOD score of 3.61 is observed around marker rs728683.

