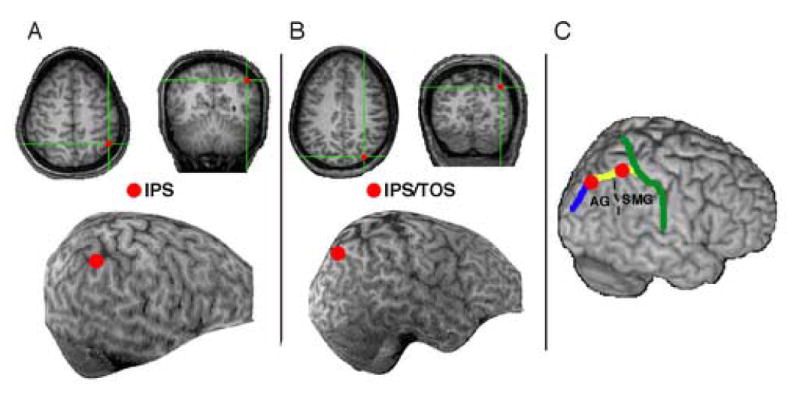
Figure 2.

Transcranial magnetic stimulation (TMS) regions of interest. (A) Right intraparietal sulcus (IPS) shown for example participant. (B) Right angular gyrus (AG) at the junction of the transverse occipital sulcus and intraparietal sulcus (IPS/TOS), shown for example participant. (C) Both sites shown on an MNI-template brain. The green line traces the post-central sulcus, the yellow line the IPS, and the blue line the TOS. Supramarginal gyrus (SMG) and AG are labeled. Coordinates in MNI space are estimated as follows: right IPS/TOS: 39, −69, 52; right IPS: 45, −48, 55; left IPS: −37, −52, 58 (not shown).
