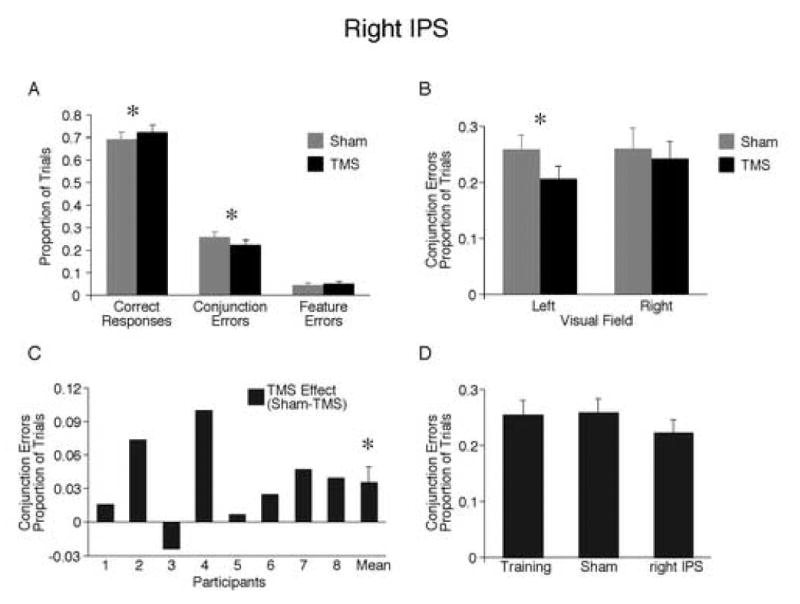
Figure 3.

TMS of right IPS. (A) Proportion of all possible response types. Fewer conjunction errors were made after TMS compared to sham. Consistently, a greater proportion of responses were correct after TMS. (B) Effect of TMS on conjunction errors across visual field. (C) Effect of TMS on conjunction errors for each participant. (D) Comparison of conjunction errors on final training, sham, and TMS blocks. Asterisks denote significant differences between conditions, p<0.05.
