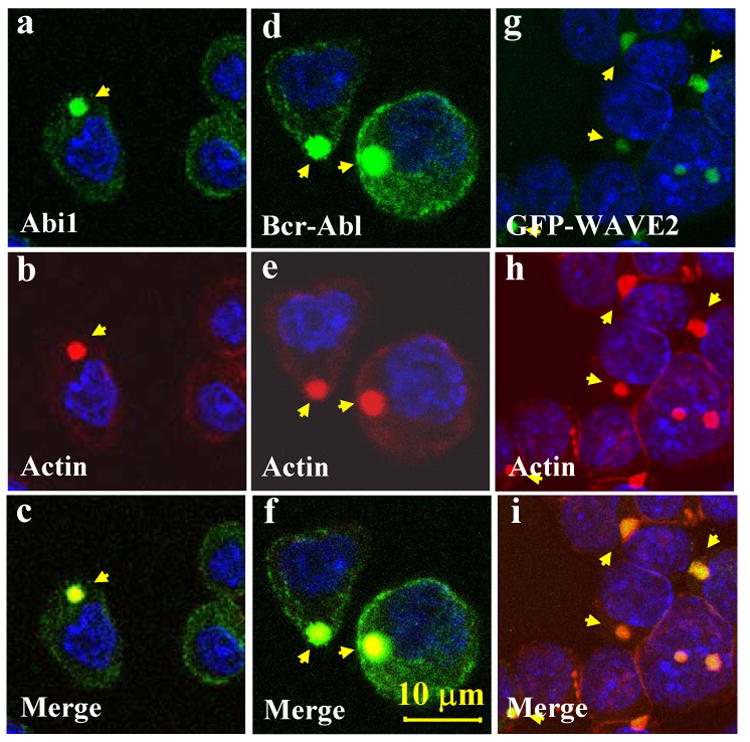
Fig. 3.

Co-localization of Abi1, Bcr-Abl and WAVE2 with an abnormal F-actin-rich structure. Ba/F3 cells expressing p185wt were probed with anti-Abi1 (a-c) and anti-Abl (d-f) antibodies, respectively. This was followed by staining with FITC-conjugated secondary antibody. Cells were then counterstained with TRITC-conjugated phalloidin and DAPI to visualize F-actin and nuclei, respectively. In panels g-i, the Ba/F3 cells expressing p185wt were transduced with retrovirus expressing GFP-WAVE2 and counterstained by TRITC-conjugated phalloidin and DAPI. Subcellular distribution of Abi1 (a, green), Bcr-Abl (d, green), GFP-WAVE2 (g, green), and F-actin structures (b, e, h, red) were visualized by two-photon confocal microscopy, as indicated by arrows. The co-localization of these proteins with abnormal F-actin structure is shown by merged images (c, f, i). Bar: 10 μm.
