Fig. 4.

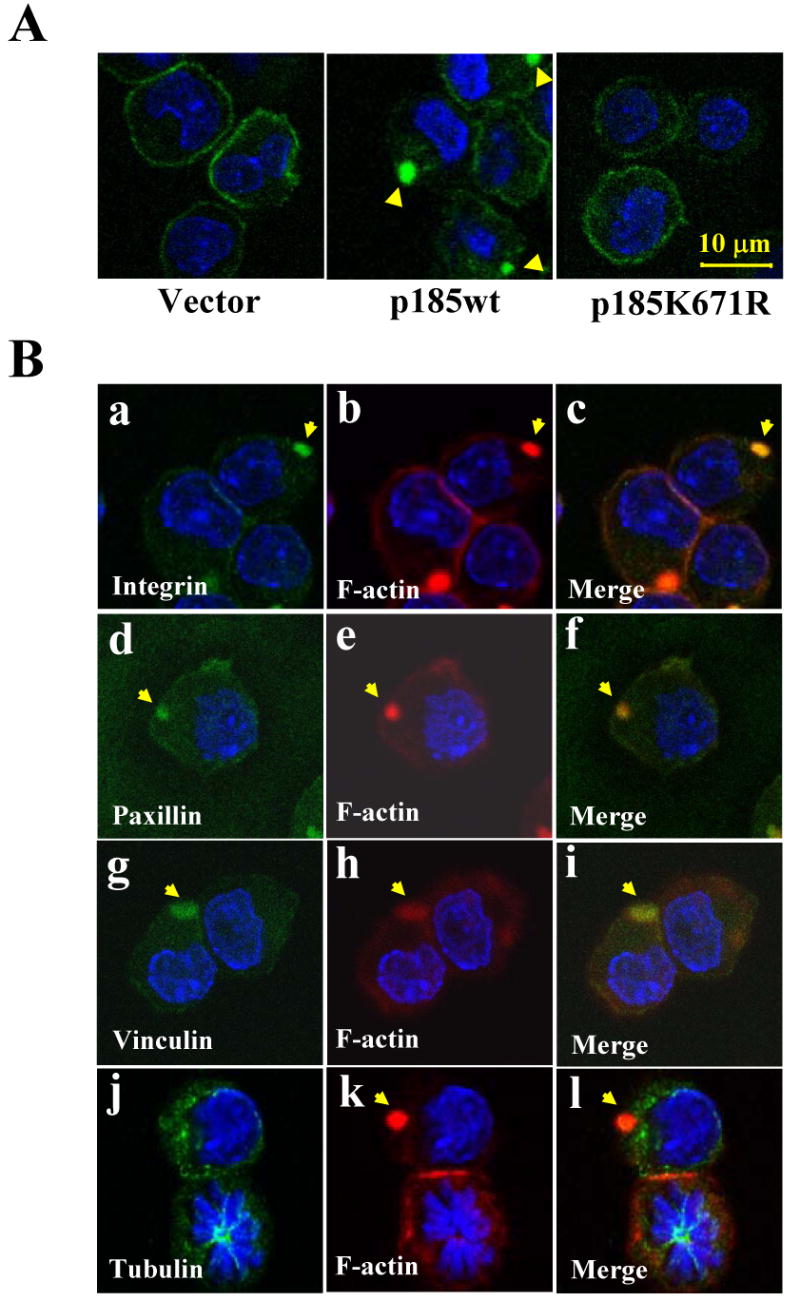
The expression of p185Bcr-Abl induced integrin clustering. A. β1-integrin clustering in p185wt-transformed Ba/F3 cells. The Ba/F3 cells transduced with indicated retroviruses were starved, fixed, and stained with FITC-conjugated monoclonal antibody against β1-integrin. Cells were then stained with DAPI to visualize nuclei. Images were captured by two-photon confocal microscopy and the β1-integrin clustering is indicated by arrowhead. Bar: 10 μm. B. Co-localization of β1-integrin, paxillin, and vinculin with abnormal actin-enriched structure. The Ba/F3 cells expressing p185wt were starved, fixed, permeablized, and probed with FITC-conjugated antibodies against β1-integrin, paxillin, tubulin, and vinculin (green), as indicated. The cells were then counterstained with TRITC-conjugated phalloidin (red) and DAPI (blue) to visualize F-actin and nuclei, respectively. Images were captured by two-photon confocal microscopy and the co-localization of integrin, paxillin, and vinculin with abnormal actin-enriched structure is shown in merged images, as indicated by arrows. Bar: 10 μm.
